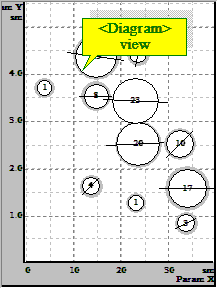
In this mode points are grouped in cells. You see the summary number of points
in cell. The means and trends (X, Y) are built on points of each cell. Groups of
points of the chart are displayed as circles (ellipses) or squares. The
area of a circle
is proportional to number of points in a cell. The center of a circle is
situated in mean point of group.